Imagine you run an office furniture company. You want to stop reordering two brands of furniture – Relaxer (a type of chair) and Boca Top (a type of table). You currently have 20,000 Relaxer chairs and 5,000 Boca Tops. These are valued at $200,000 and $100,000 respectively. When sold, they will yield $100,000 and $25,000 gross profit. You are hoping to sell them off in 2 or 3 years. You forecast that we can sell off these as per below.

You need to analyze this and prepare a cash flow model.
Let’s learn how to answer such open ended questions using various analysis techniques in Excel.
The case in this article is based on a forum question by Proteus.
Setting up the problem
Most business case problems will have following three kinds of parameters
- Fixed Inputs – for example opening stock of chairs & tables, book value of these items
- Variables – Number of chairs and tables sold every month (or year), profit expectation
- Assumptions – We will be able to sell off all the items (ie no write offs), Profit per unit and book value per unit doesn’t change over time
Of course, these three categories can overlap. Use your experience and industry knowledge to define what items belong where.
Why bother – can’t everything be a variable?
Of course, you can consider everything to be a variable in your model. This will give maximum flexibility, but comes with a lot of cost. Your model becomes complicated and can take a lot of time to develop. It might be overkill, so identify a few constants (fixed inputs).
Once your model is in Excel, all input cells can be edited. So technically all are variables.
Define outputs
The next step is to identify outputs. In this case, we can calculate three kinds of outputs.
- Number of chairs & tables sold by month
- Revenue by month
- Profit by month
We can add an optional output – visualization of the results.
How to go from inputs to outputs
This is where we figure out the business rules and calculation logic to arrive at outputs from inputs.
Let’s define formulas for each output
- Units sold per month = this year’s portion of total stock / 12
- Revenue per month = units sold per month * book value per unit
- Profit per month = units per month * profit per unit
Initial Model
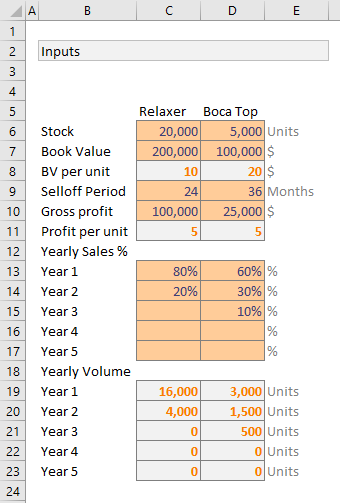
Set up the input area like below. The orange cells contain user inputs. Gray ones have calculated values.

Everything in the above picture is self-explanatory, so let’s move on to output section.
Note:If your business problem is complex, you need to setup dedicated worksheets for each type of input (fixed, variable and assumption). This will let you play with various combinations and control outputs in a better way.
Calculating outputs
The tricky part is figuring out units of chairs & tables sold per month. Once we have these numbers, calculating revenue & profit per month is easy.
Let’s run the outputs for 60 months. Although your initial estimates suggest that all stock will be sold in first 3 years, this allows you to monitor cash flows over 5 years, should there be a change in the inputs.
Let’s say month numbers are in column G, from G6 to G65.
Given,
- the month number in G6
- Yearly chair volume in range C$19:C$23
Refer to inputs picture in above section for cell references.
We can calculate number of chairs sold in that month using below formula (call it formula 1)
- Units of chairs per month (cell H6) =INDEX(C$19:C$23,INT(($G6-1)/12)+1)/12
How does this formula work?
Simple, we pick the volume for year represented by month using INDEX formula. To calculate year from month (G6), we use simple arithmetic: INT(($G6-1)/12) + 1
Once yearly volume is picked, we just divide it by 12 to get monthly volume (ie units sold per month).
Notice the mixed referencing style used, this will help you drag and reuse the same formula for calculating table volume.
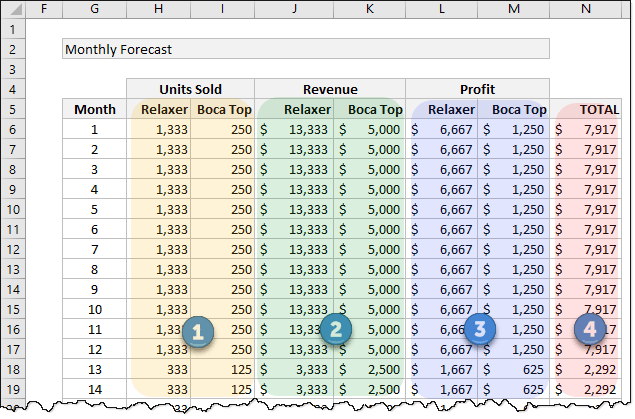
The calculated volume figures go in to columns H & I.
Calculating Revenue, Profit & Total Profit
Now that we know units sold per month, calculating remaining three outputs is easy.
- Revenue of chairs (cell J6) = H6 * C$8(Note: C$8 has the book value per chair)
- Profit of chairs (cell L6) = H6 * C$11
- Total Profit (cell N6) = L6 + M6
Refer to below diagram to see sample results along with formula numbers.

Let’s add scenarios to this model
Our initial model is a simple formula driven tabulation of results. But what if you want to see profit flow by different scenarios? May be the initial yearly forecasts by marketing department are too optimistic and you want to see what happens if we sell fewer chairs in first year.
Let’s assume we have 10 such scenarios and for each scenario, you want to define below inputs:
- Profit per unit
- Yearly breakdown of volumes for 5 years
This means, we have a total of 12inputs per scenario (6 for tables and 6 for chairs)
Set up scenario table like this in the spreadsheet:

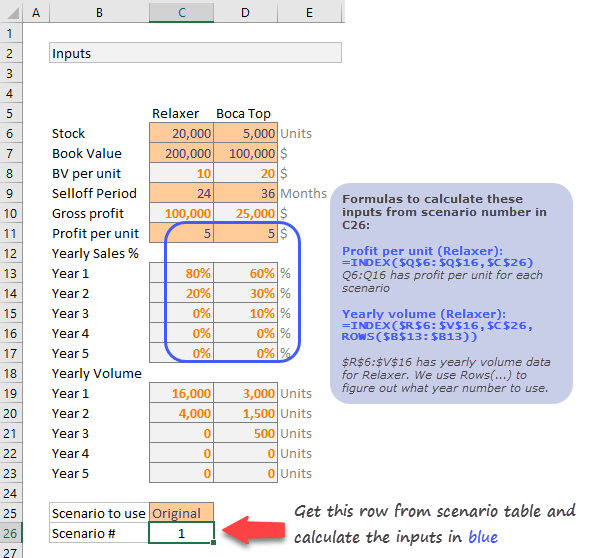
Now that we have scenarios to define some of our inputs, let’s plug in scenario number in to input section, as shown below.

Calculating Total Profit for each scenario
This is when we unleash the beast – Data Tables.Using data tables, we can quickly calculate total monthly profit for each of the 10 + 1 scenarios.
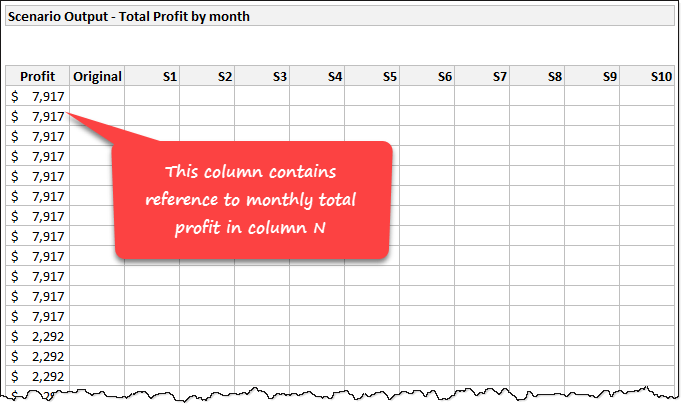
Set up an empty scenario grid as shown below.

Make sure first column refers to the monthly total profit calculated in column N (N6:N65) in our initial model. Once such a grid is setup, use below steps to calculate profit under each scenario.

- Select entire grid including first column (referenced one) and headers.
- Go to Data > What if analysis > Data tables
- Select Row input cell and point to scenario name in input area (cell C25 in my model).
- Click ok.
- Wham!!! Excel calculates profit for each of the 11 scenarios for all 60 months (total 660 values calculated before you could say six sixty 🙂 )
That’s a lot of numbers, how to make sense?
While scenario based modeling is good, it presents a new challenge. How do you make sense of all this new data? Simple, make a chart.
There are many ways to visualize this data. Here is one:

I have visualized only first 5 scenarios (original + 4 more). You can change this depending onwhat each scenario represents.
Related: Introduction to Data Tables in Excel
Model 2 – What if we don’t sell same volume every month
Now we all know that no business sells same volume every month. You will have a few high months and few low ones. So how to add monthly variations to the model?
Let’s say you have monthly % splits for Relaxer and Boca Top defined in range as shown below:

We can plug this new information in to our model by altering formula 1 (units per month). Everything else will work nicely once formula 1 is fixed.
Here is the new formula 1 (units per month). Figuring out how it works is your homework.
=INDEX(C$19:C$23,INT(($G6-1)/12)+1) * INDEX(C$30:C$41,MOD($G6-1,12)+1)
Please note:
- C$19:C$23 has yearly volume for Relaxer
- G6 has month number
- C$30:C$41 has monthly % split for Relaxer
Once you alter formula 1, you can see how it effects the cash flow (revenues & profits per month) over 5 years.
Model 3 – What if we don’t know how much we can sell each year
You can buy a broomstick from Quality Broomstick Supplies in Diagon Alley before you canaccuratelyfigure out how much you will sell each year. It is almost impossible.
But our entire model depends on this input. What if we don’t know the yearly volumes?
May be we can assume first month volume & monthly variations (as defined in Model 2 above) and figure out yearly volumes. Since first month volume is a variable, we can alter it to see what kind of cash flow it would produce.
Something like this:

Setting up a starting month based forecast model
Let’s say we know first month volumes for Relaxer & Boca Top – Cells C43& D43respectively.
We can calculate forecast in a few ways:
- We can calculate yearly volume by multiplying Q21 with first month’s percentage (as defined in Model 2)
- We can calculate successive month volumes by increasing / decreasing first month’s volume by monthly % changes (this requires new inputs)
- We can simulate monthly volumes by randomly varying first month’s number while following some sort of monthly split pattern
2 & 3 require new inputs or data tables to be set up. Since we have already beaten this problem to death, let’s just stick to approach 1.
We calculate yearly volumes by using simple formulas like this:
- Year 1 (cell C19) =MIN(C43/C28, C$6) (C43 has first month volume and C28 has first month %)
- Year 2 on wards: =MIN(C$19,C$6-SUM(C$19:C19))
Note: C6 has total stock of Relaxer. We can only sell if there is any stock left. If first month volume is too high, then we may end up selling out quickly.
Once these volumes are calculated, we just visualize results (monthly profit columns L & M) in a line chart.
If you link inputs C43 & D43 with two separate scrollbar form controls, you can play with them in the chart and quickly analyze the results. Now that is pretty cool.
Related: Introduction to Excel form controls |Using scrollbar form control in Excel Models
Download workbook with all models
Click here to download Excel Workbookcontaining all the models discussed so far. Play with them or create your own models to analyze the problem. Learn and flourish.
50 more ways toanalyze data like a rock star
If you like this, you are going to love my upcoming new course –50 ways to analyze data. Learn best ways to analyze any kind of data along with a deep dive in to advanced Excel featuresandcase studies in this online class.Check out our 50 ways to analyze data program.We are opening enrollments in First week of May 2017. Click below button to sign up to course waiting list andknow more about the program.